Mule MMC - Server memory monitoring
Mule Managment Console provides OS resources monitoring. Unfortunately, in contrary to screenshots in documentation installed version (3.6.1) of MMC that I’m using shows only last 15 minutes. I need at least 12 hours to document endurance test results. Having memory statistics for production server for last two weeks is crucial in incidents debugging.
Seeking solution has started with case opened with support regarding performance analysis tab:
Case question: “Under Server-> Memory tab, is there a way to access more than last 15 minutes of data?”
Support answer: “Regarding the memory tab graphs. The time lapse is fixed to 15 minutes. The images are regenerated with the information of that period. For a extended analysis of memory usage you should use an external profiler.”
I examined other tools. I got CA Willy Introscope set up on old JBoss applications servers and tried to connect it to Mule ESB instance using ‘Tomcat’ agent. Results were not impressive - only basic memory statistics were gathered. It is not worth paying for additional production Introscope licenses for each ESB node.
Final option to explore was MMC Admin shell. Inspiration came from Tcat admin console groovy scripts for saving JMX metric data. I couldn’t find any samples on accessing memory information. MMC source code is also not available on any public code repository. But you can get a lot of information from spring configuration and GWT application interfaces. Knowing what services are available and how to use them allowed me to create script below:
1
2
3
def svr = applicationContext.getBean("serverManager").getServerByName(serverName, false)
com.mulesoft.common.remoting.RemoteContext.setServerId(svr.getId())
applicationContext.getBean("v1/memoryService").getMemoryPools()
After getting memory pools information next task was to figure out how to store it - preferable in the flat files, rolled daily for easy access. Instead of directly writing to the file I decided to use ‘log4j2’ logger available on MMC. In official documentation there is a small hint how to set up script logs. I wanted to have separate file for each server, so I decided to use RoutingAdapter with RollingFileAppender
1
2
3
4
5
6
7
8
9
10
11
12
13
14
15
16
17
18
19
20
21
22
23
24
25  <Routing name="SCRIPTS">
            <Routes  pattern="$${ctx:servername}">
                <!--no key-->
              <Route key="$${ctx:servername}">
                <File name="scripts" fileName="${sys:scriptLogsDir}/scripts.log">
                        <PatternLayout>
                                <Pattern>%d %p %m %ex%n</Pattern>
                        </PatternLayout>
                </File>
              </Route>
              <Route>
        <!-- key provided -->
                <RollingFile name="memory-${ctx:servername}" fileName="${sys:scriptLogsDir}/memory-${ctx:servername}.csv"
        filePattern="${sys:scriptsLogDir}/${date:yyyy-MM}/memory-${ctx:servername}-%d{yyyy-MM-dd}.csv">
                <PatternLayout>
                        <pattern>%d{HH:mm:ss} %m %n</pattern>
                </PatternLayout>
                <Policies>
                        <TimeBasedTriggeringPolicy interval="1" modulate="true" />
                </Policies>
                        <DefaultRolloverStrategy compressionLevel="0"/>
                </RollingFile>
               </Route>
             </Routes>
          </Routing>
Note: Remember to add -DscriptLogsDir variable to JAVA_OPTS settings for your MMC container
To keep root logger clean I configured separate logger for Memory Statistics shell script:
1
2
3
<Logger additivity="false" name="admin.shell.script.[Memory Statistics]" level="DEBUG">
<AppenderRef ref="SCRIPTS"/>
</Logger>
To route each server stats to different file variable servername must be set up in log4j2 ThreadContext before each logging entry. It is used in RollingFile appender name and file pattern.
Finally Memory Statistics shell script itself. Remember to Save it As Memory Statistics to match logger configuration)
1
2
3
4
5
6
7
8
9
10
11
12
13
14
15
16
17
18
19
20
import com.mulesoft.common.remoting.RemoteContext
import org.apache.logging.log4j.ThreadContext
import static java.math.MathContext.DECIMAL32
def toMB = {size -> (size/1024/1024).round(DECIMAL32)};
['xxx01', 'xxx02'].each {servername ->
try {
ThreadContext.put('servername', servername)
def svr = applicationContext.getBean("serverManager").getServerByName(servername, false)
RemoteContext.setServerId(svr.getId())
applicationContext.getBean("v1/memoryService").getMemoryPools().each { pool ->
if ('TOTAL'.equals(pool.type)) {
log.debug("," + toMB(pool.max) + ',' + toMB(pool.used) + ',' + toMB(pool.committed))
}
}
} finally {
ThreadContext.clearAll()
}
}
All values are rounded to MB.
To have stats each 30 seconds add script execution to scheduler with proper CRON trigger expression. In my opionion 30s is good enough - all major GCs should be easy to spot with that frequency.
Memory Statistics script log file format is csv. Sample below
14:52:30 ,12630.53,2843.382,5697.957
14:53:00 ,12630.53,3346.423,5697.957
14:53:30 ,12631.23,2523.058,5719.858
14:54:00 ,12631.23,3032.975,5719.858
14:54:30 ,12631.98,2202.297,5719.227
14:55:00 ,12631.98,2704.517,5719.227
14:55:30 ,12632.99,2361.855,5721.625
14:56:00 ,12632.99,2935.656,5721.625
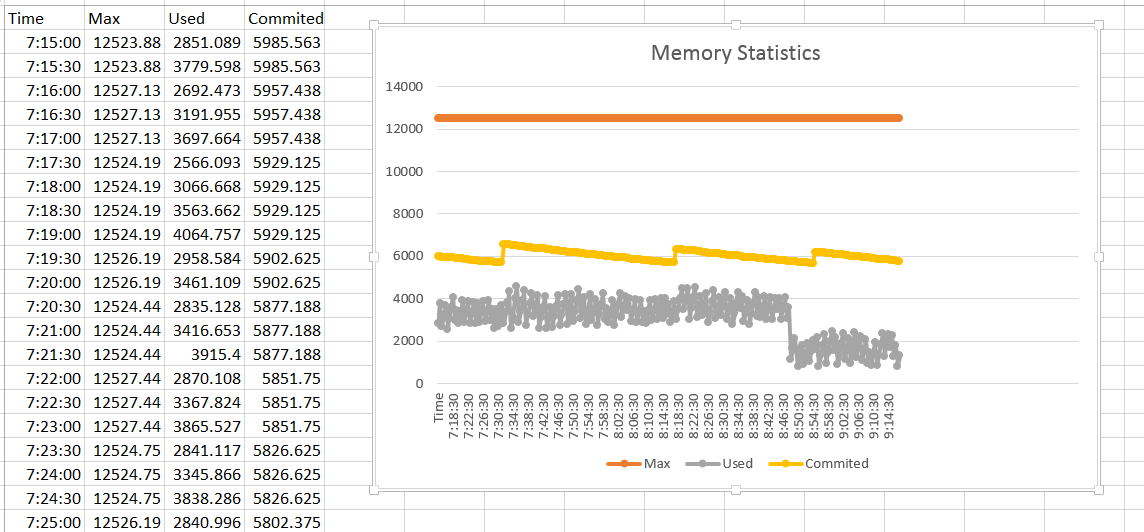
It is easy to open those files as Excel spreadsheet. After that mark the whole imported data, insert line chart and memory statistics graph for any given time period is ready for analyse.
The same method can be used for gathering all other kinds of statistics from Mule ESB nodes - different memory pools, flows execution times, number of concurrent requests, active threads count or anything else available in MMC.

